


Gif showing the 3rd week of data collection
a cup spining with 3rd weeks data
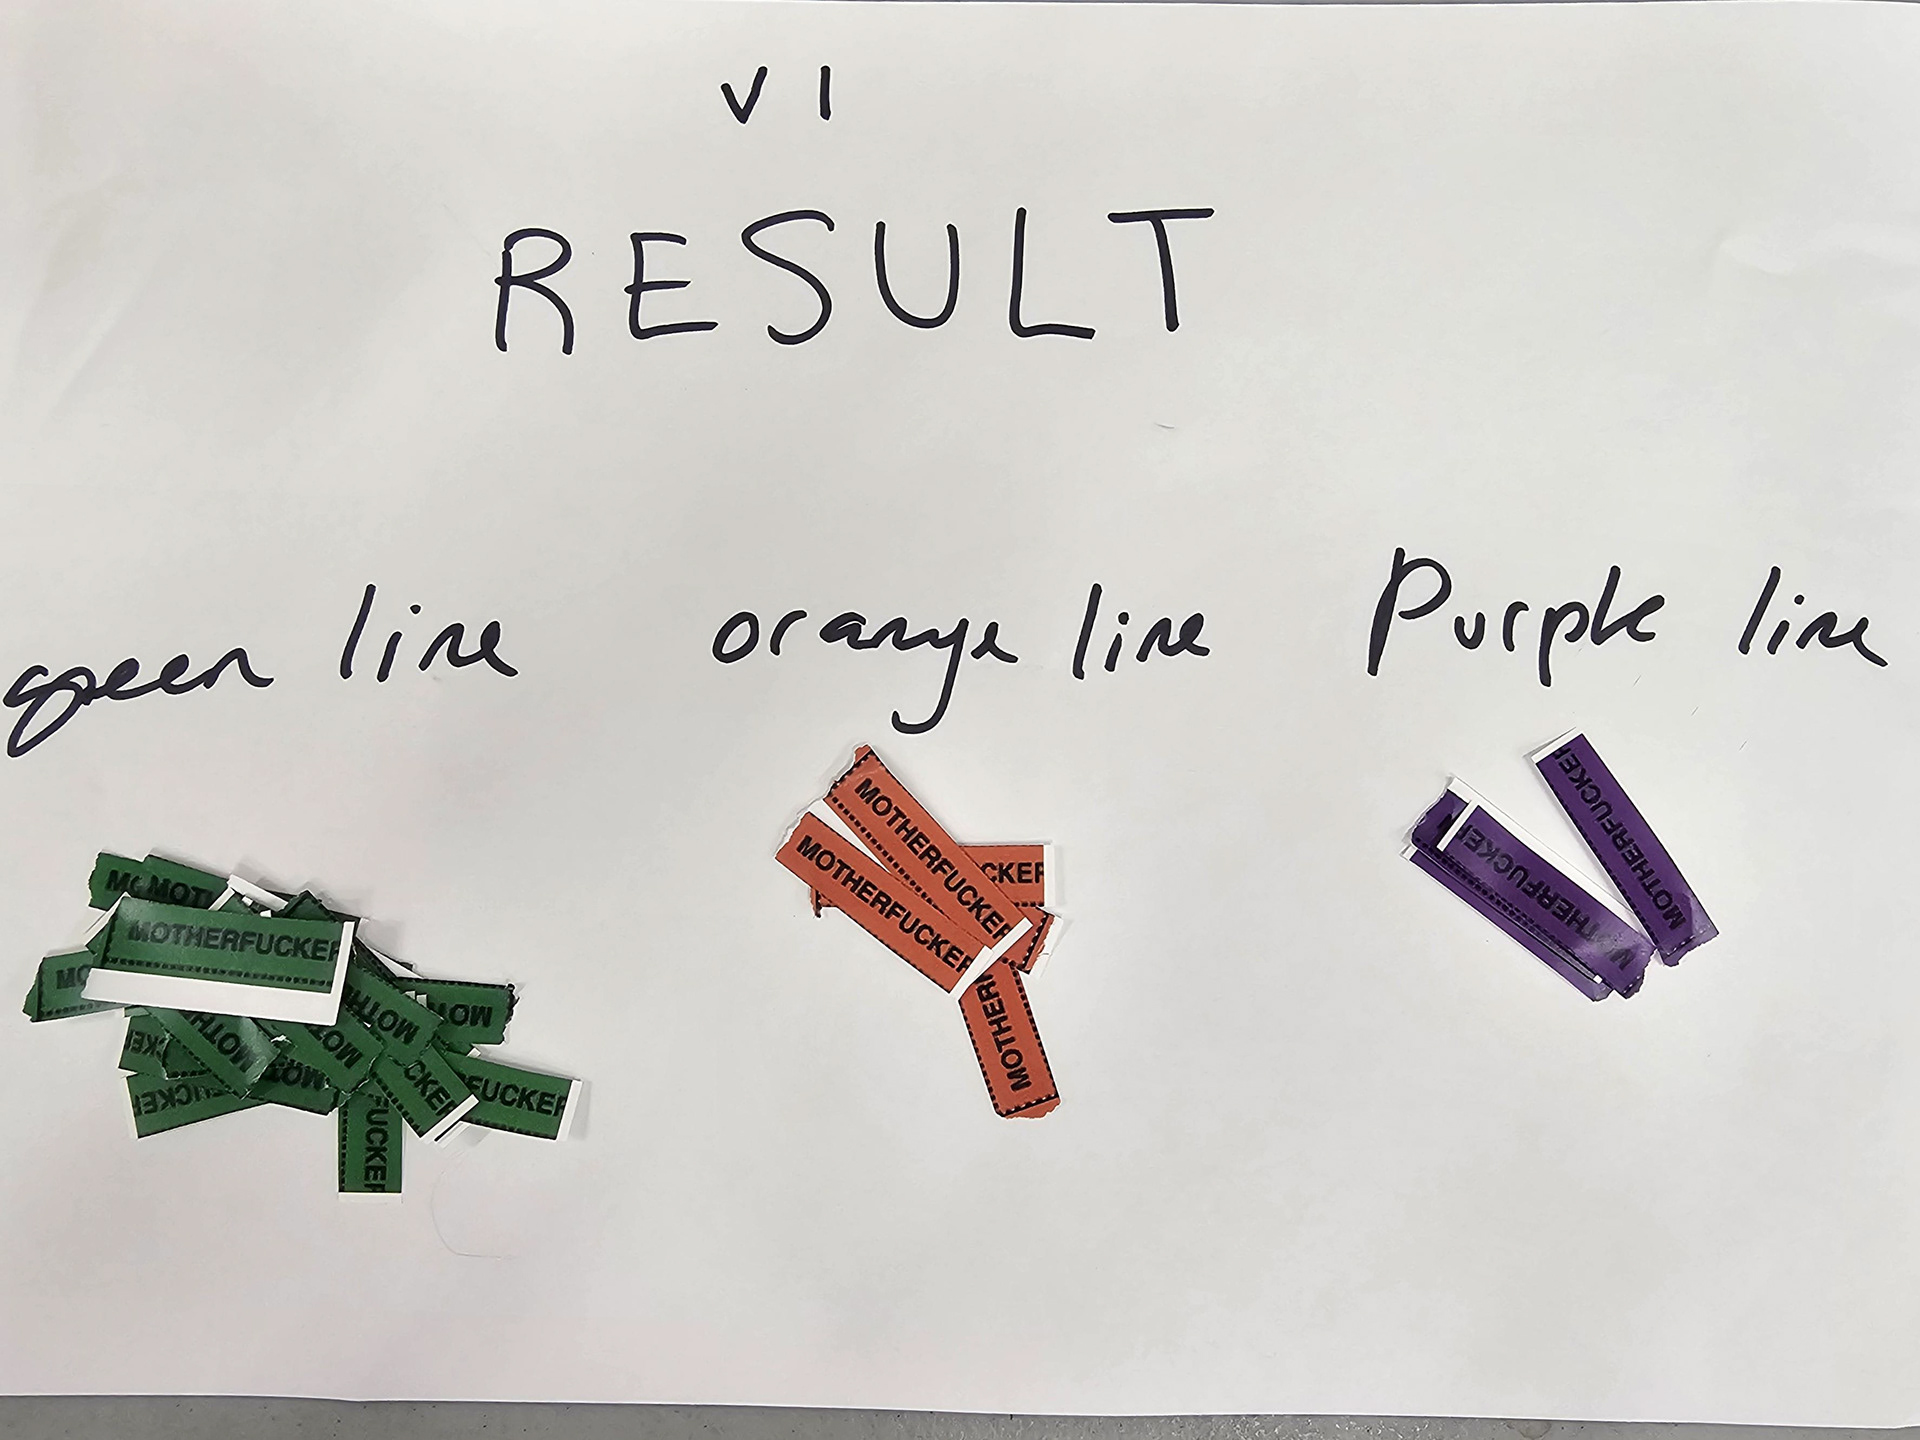
visual display of w3's data
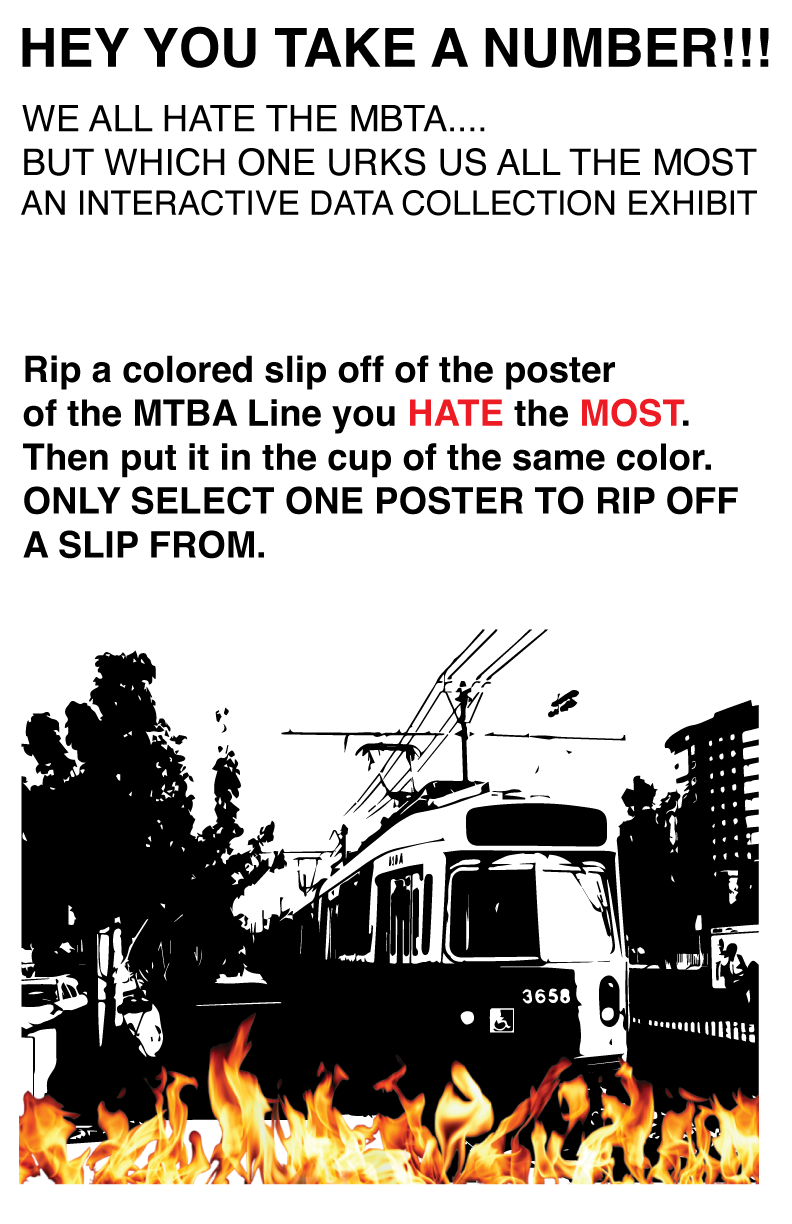
The instructions

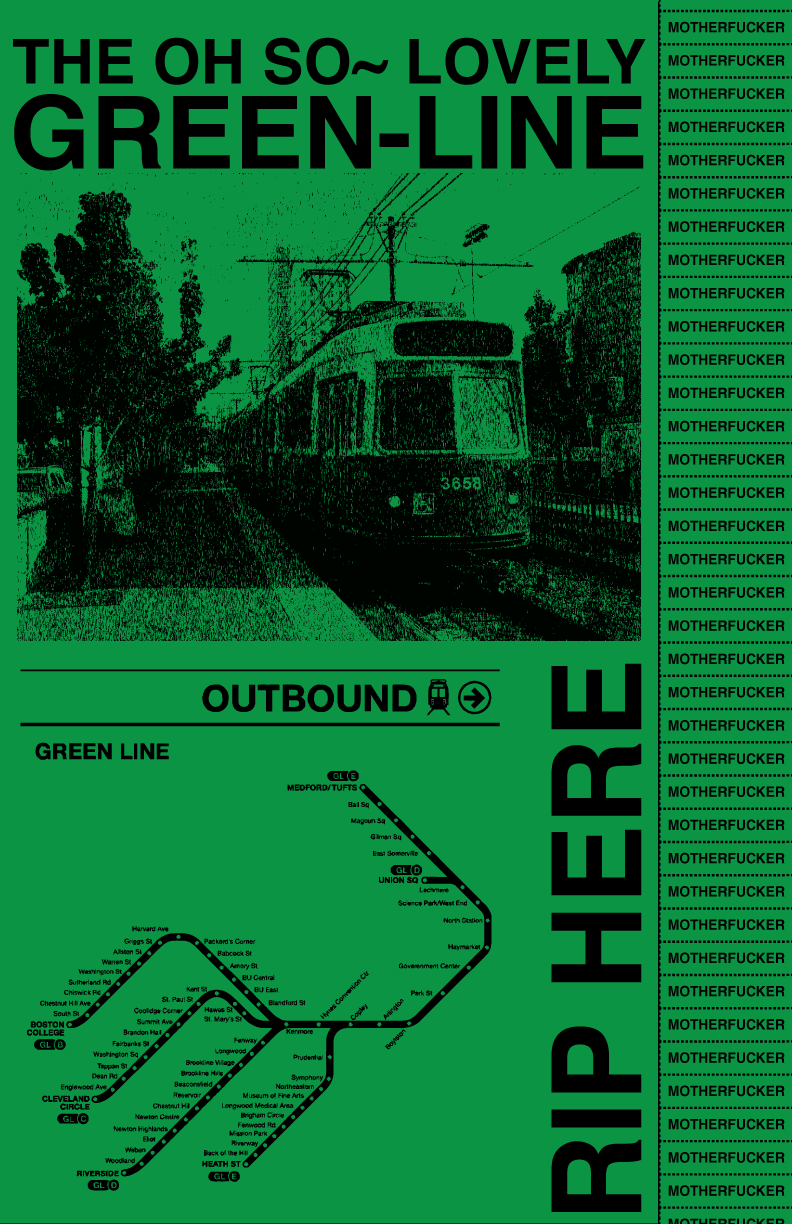
Green line Poster

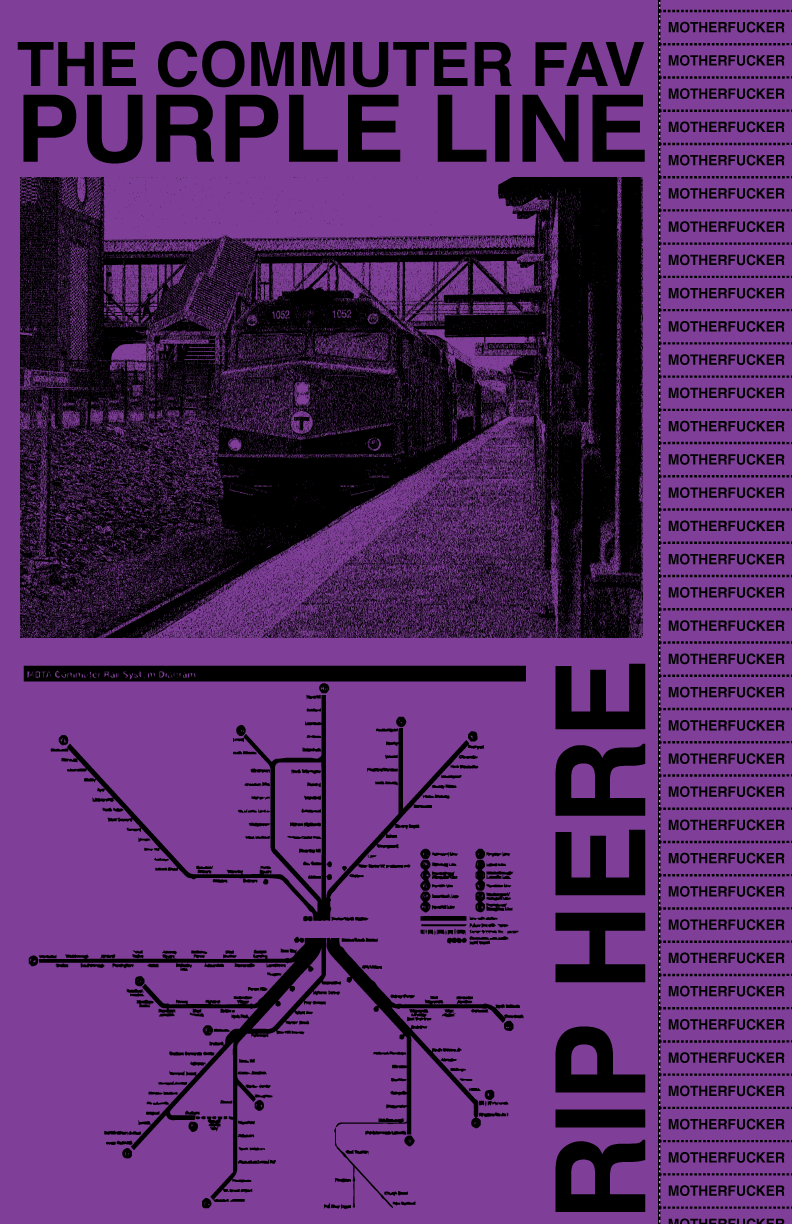
Purple line Poster

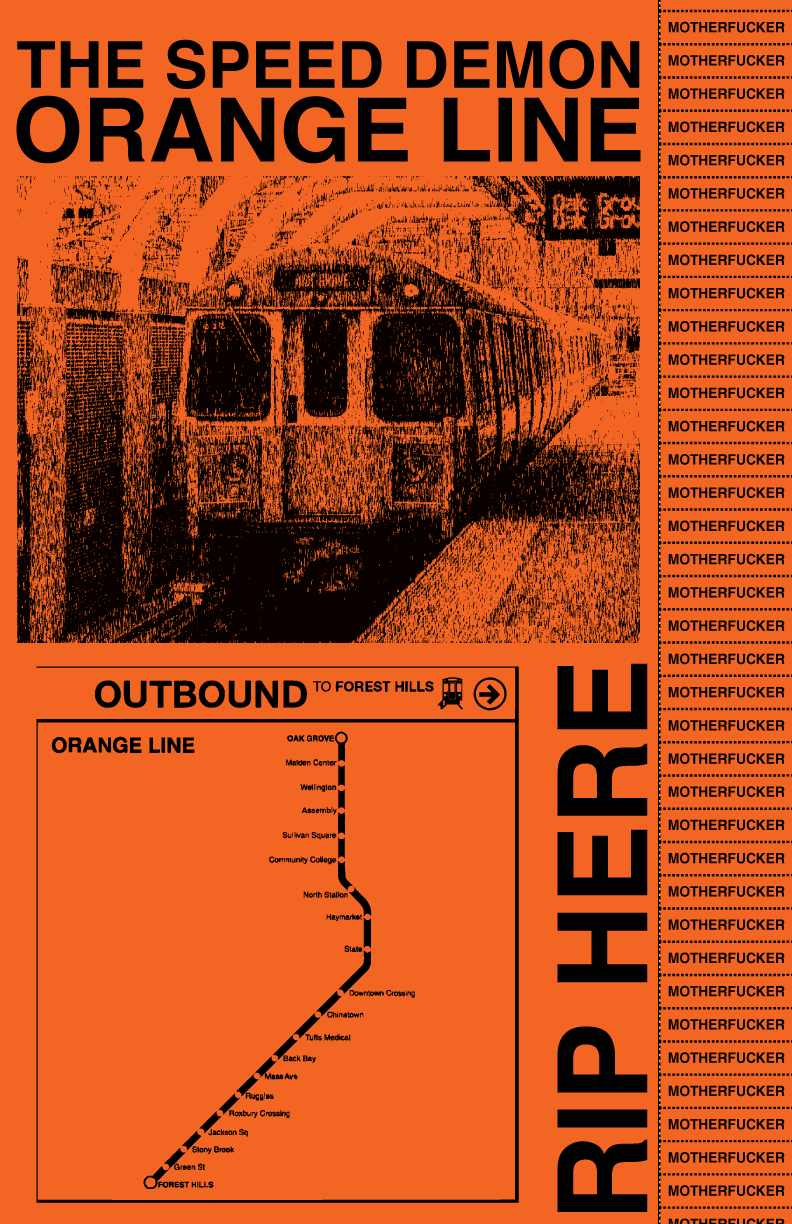
Orange Line Poster

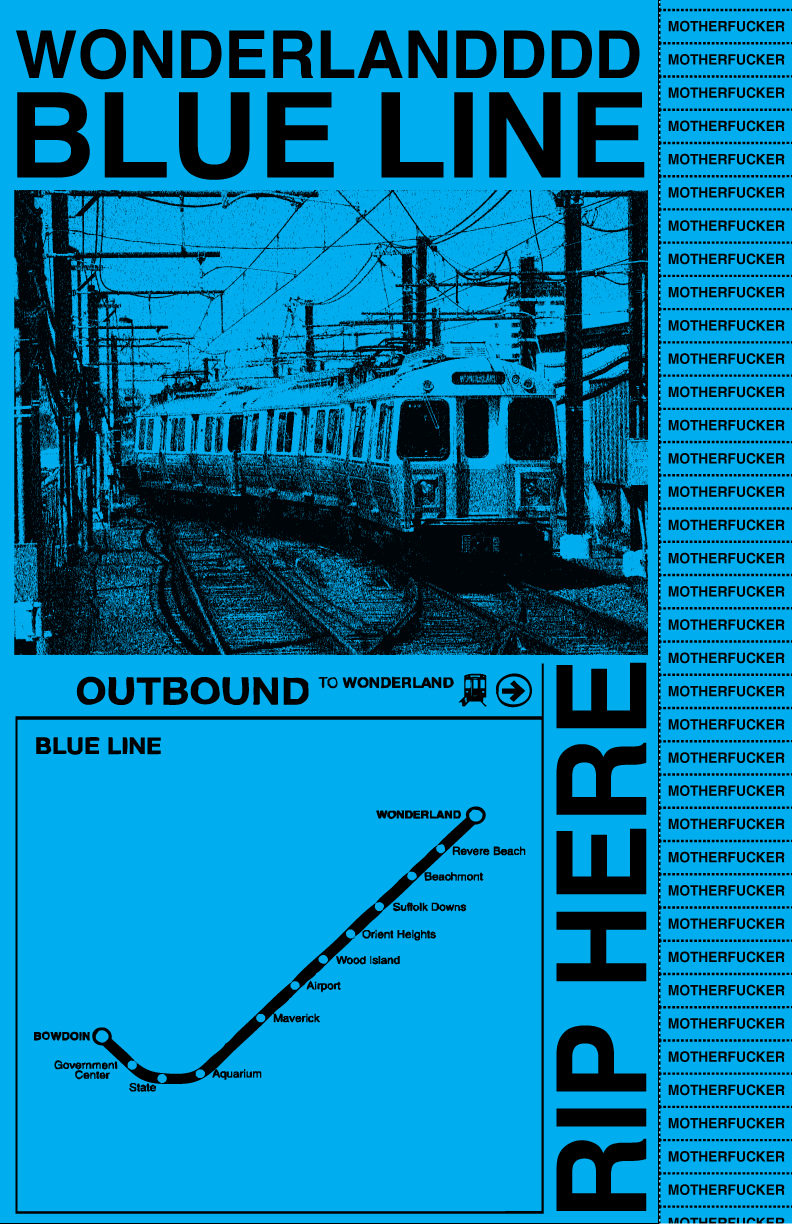
Blue Line Poster


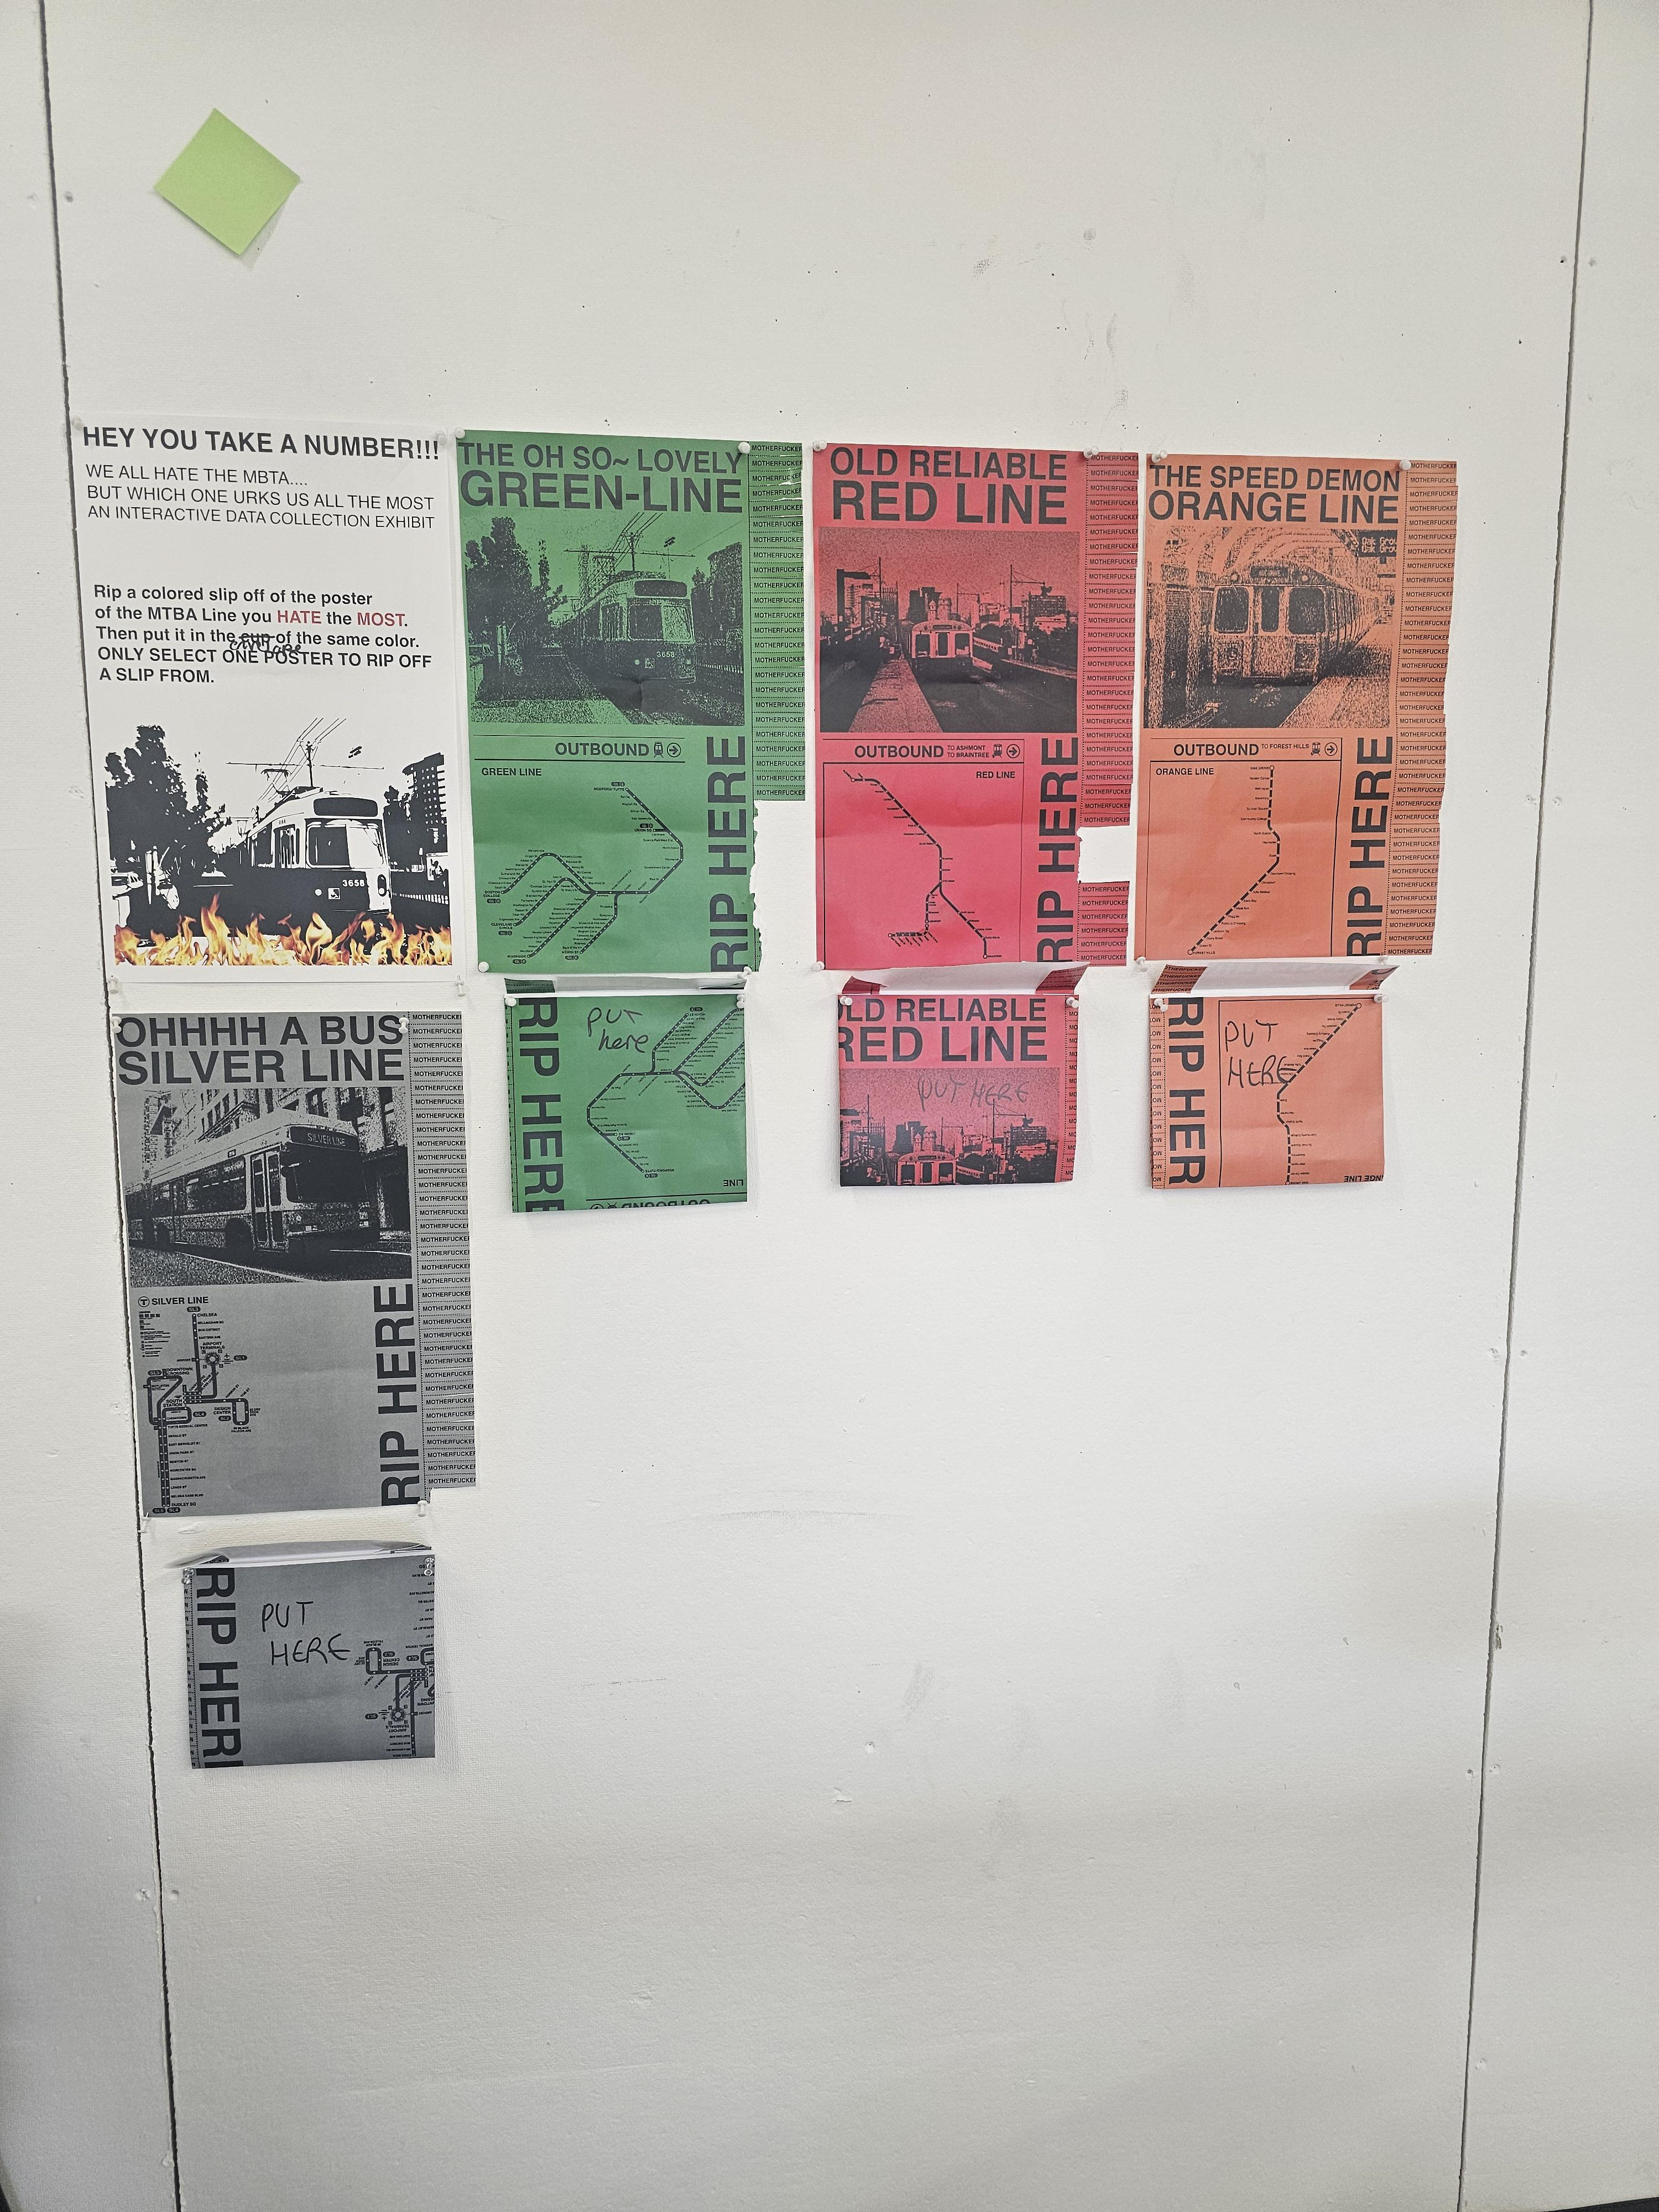
W4: Updated poster set and collection method

Flip-through gif of all my posters
The final data set is the following:
Orange line= 6
Green Line= 23
Red Line=2
Purple Line=4
Blue Line= 0
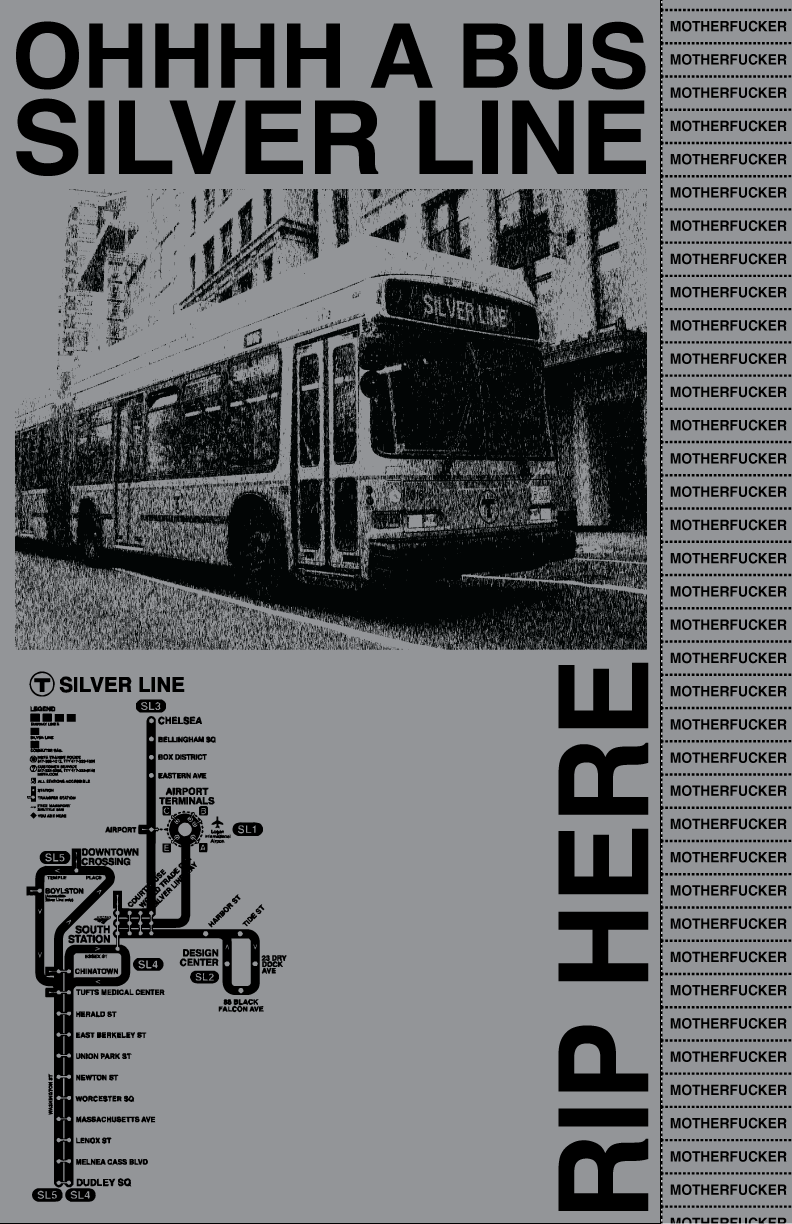
Silver Line= 2
Orange line= 6
Green Line= 23
Red Line=2
Purple Line=4
Blue Line= 0
Silver Line= 2
Documentation